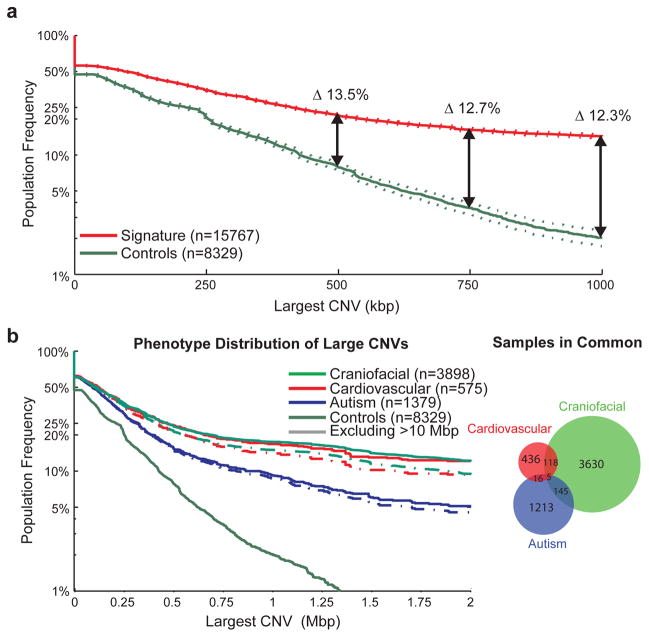
Figure 1. CNV size distributions in affected and unaffected individuals.
The population frequency of the largest CNV in a sample is displayed as a survivor function with the proportion of samples carrying a CNV of a given size displayed as a curve, with 95% confidence intervals indicated by dotted lines. (A) The distribution of large CNVs in the Signature set (filtered to only contain events detectable by the Illumina 550K array) versus our control population (downsampled to only events detectable by the Signature 97K array) is indicated for the overall population. After corrections for different array densities, we observed a >13.5% increase in CNV burden beyond 500 kbp in cases with a proportion of the burden representing potentially novel loci. (B) We also performed a similar analysis on subphenotypes; in this analysis, we included all Signature CNVs in conjunction with downsampled control CNVs as we are highlighting interphenotype differences rather than case versus control frequencies. This is demonstrated here for the autism, cardiovascular and craniofacial phenotypes, which represent fairly distinct sample sets and show an increased burden for the cardiovascular and craniofacial phenotypes, even after exclusion of karyotypically visible (>10 Mbp) events.

