
Figure 5.
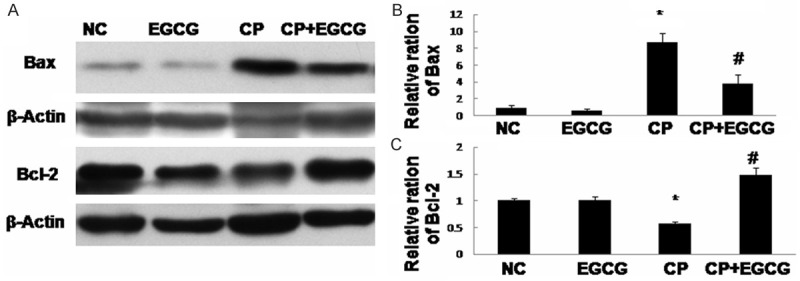
Western blot analysis of Bax and Bcl-2 (A), and quantification of the protein levels (B, C). Mice treated with vehicle, EGCG, CP, and CP+EGCG. Data are expressed as mean ± SD. *p<0.05 versus control group; #p<0.05 versus CP group.
Official websites use .gov
A
.gov website belongs to an official
government organization in the United States.
Secure .gov websites use HTTPS
A lock (
) or https:// means you've safely
connected to the .gov website. Share sensitive
information only on official, secure websites.
Western blot analysis of Bax and Bcl-2 (A), and quantification of the protein levels (B, C). Mice treated with vehicle, EGCG, CP, and CP+EGCG. Data are expressed as mean ± SD. *p<0.05 versus control group; #p<0.05 versus CP group.